
Top 10 FAQs from Customers
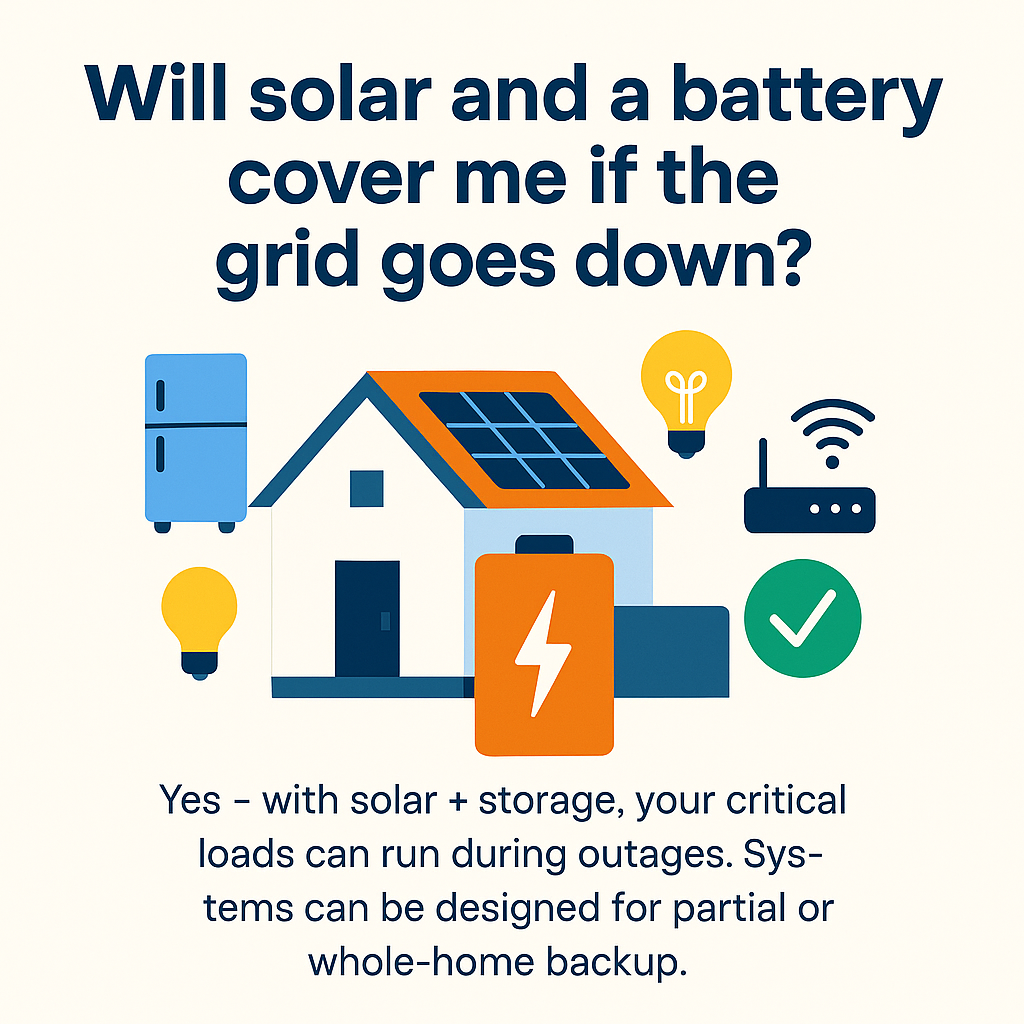

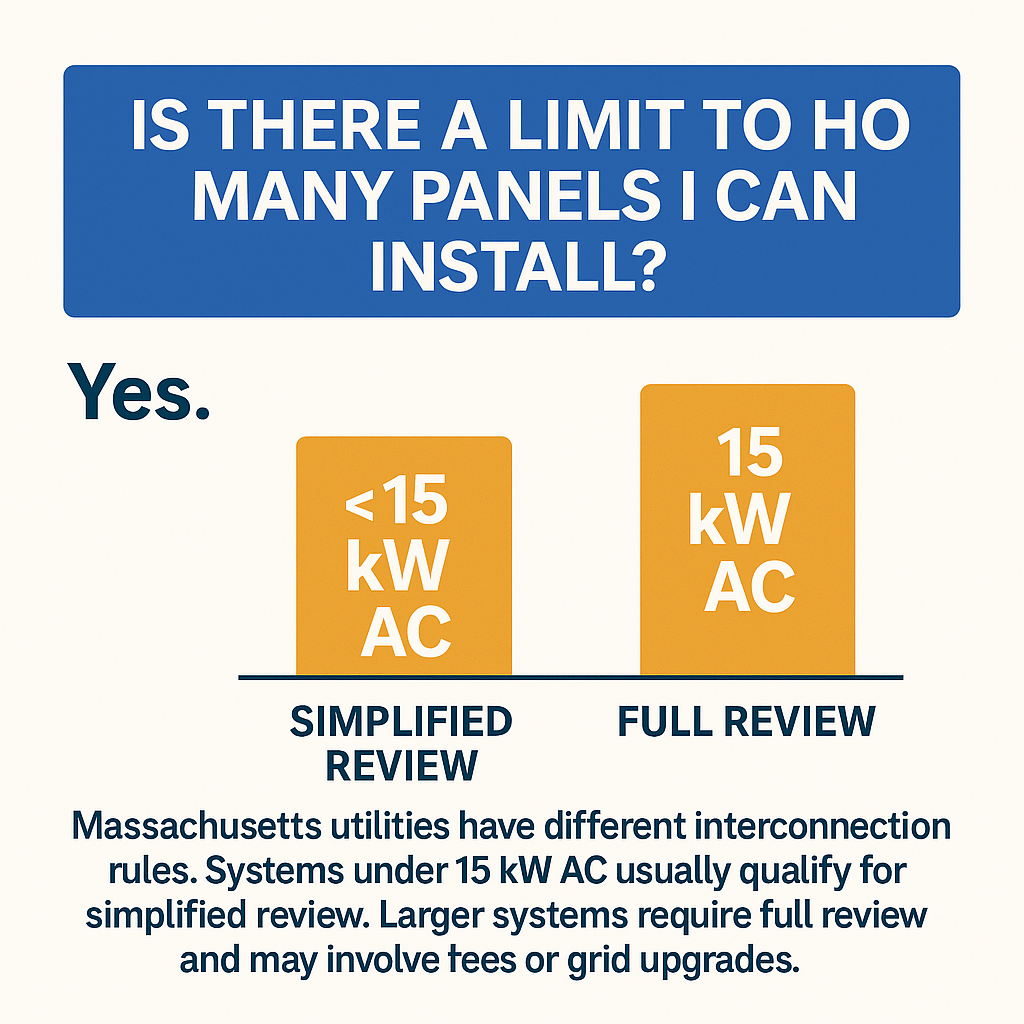
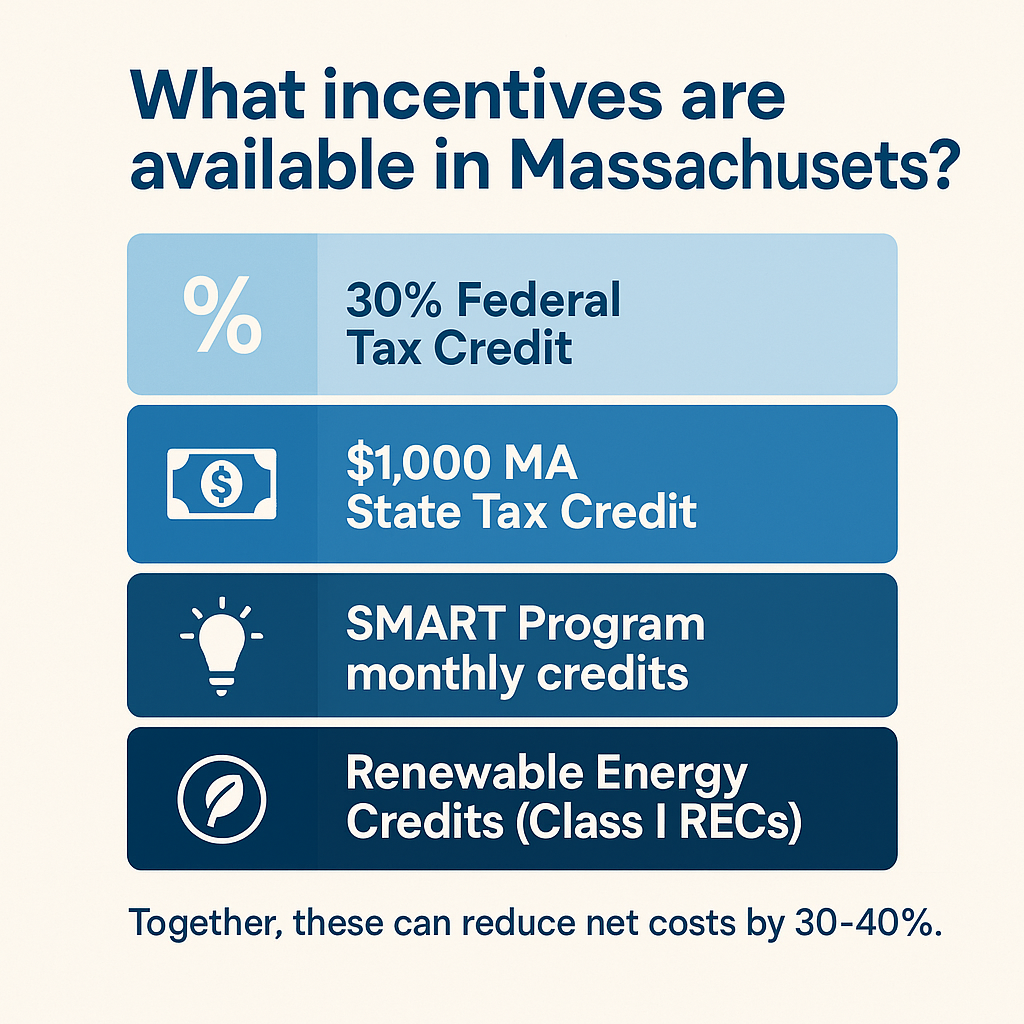
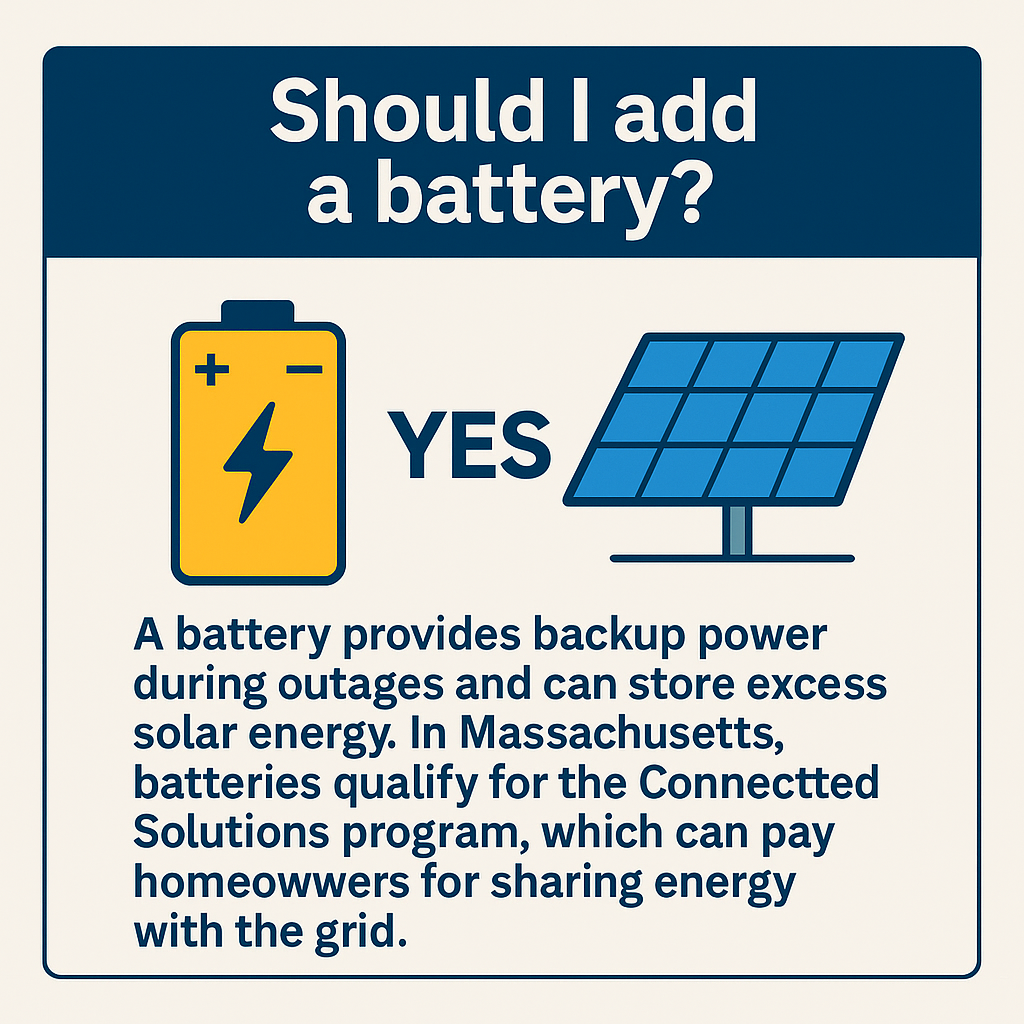


myths about solar, 5 facts about the solar system
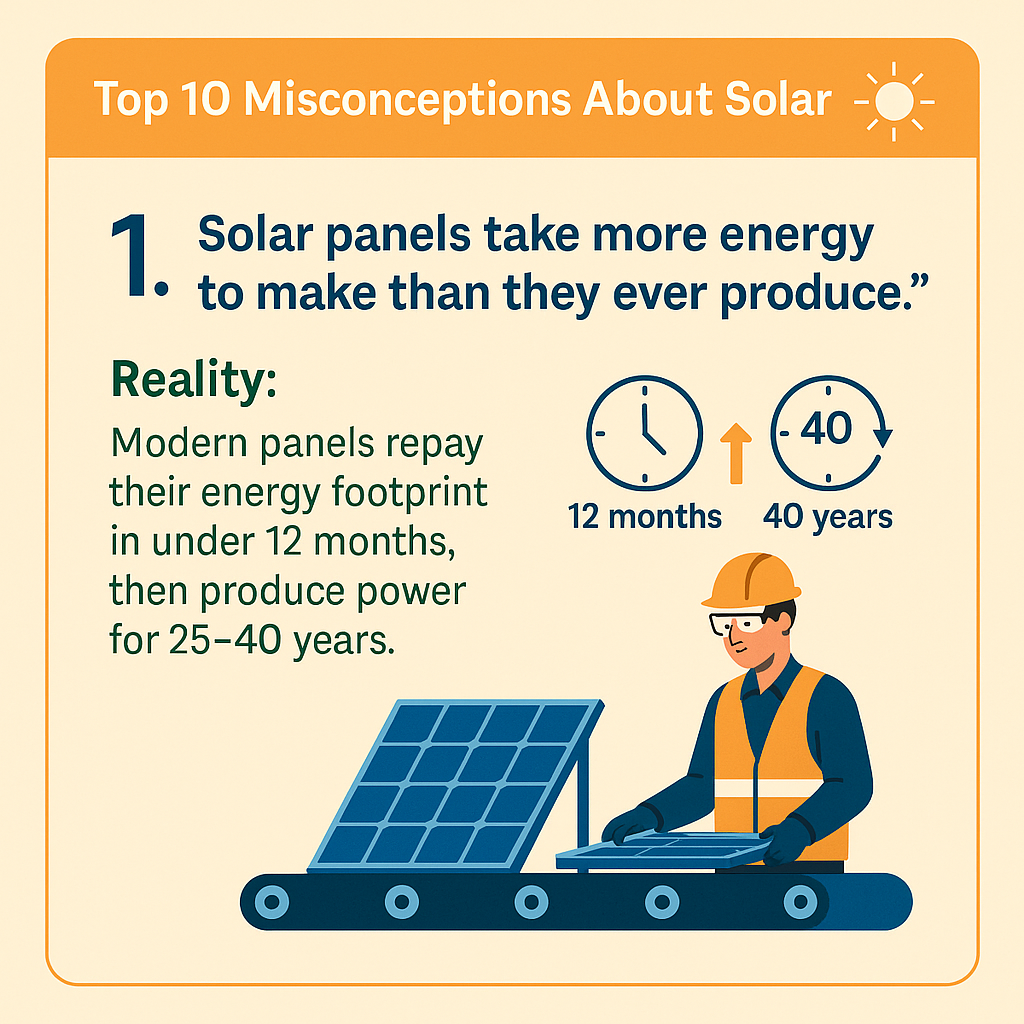
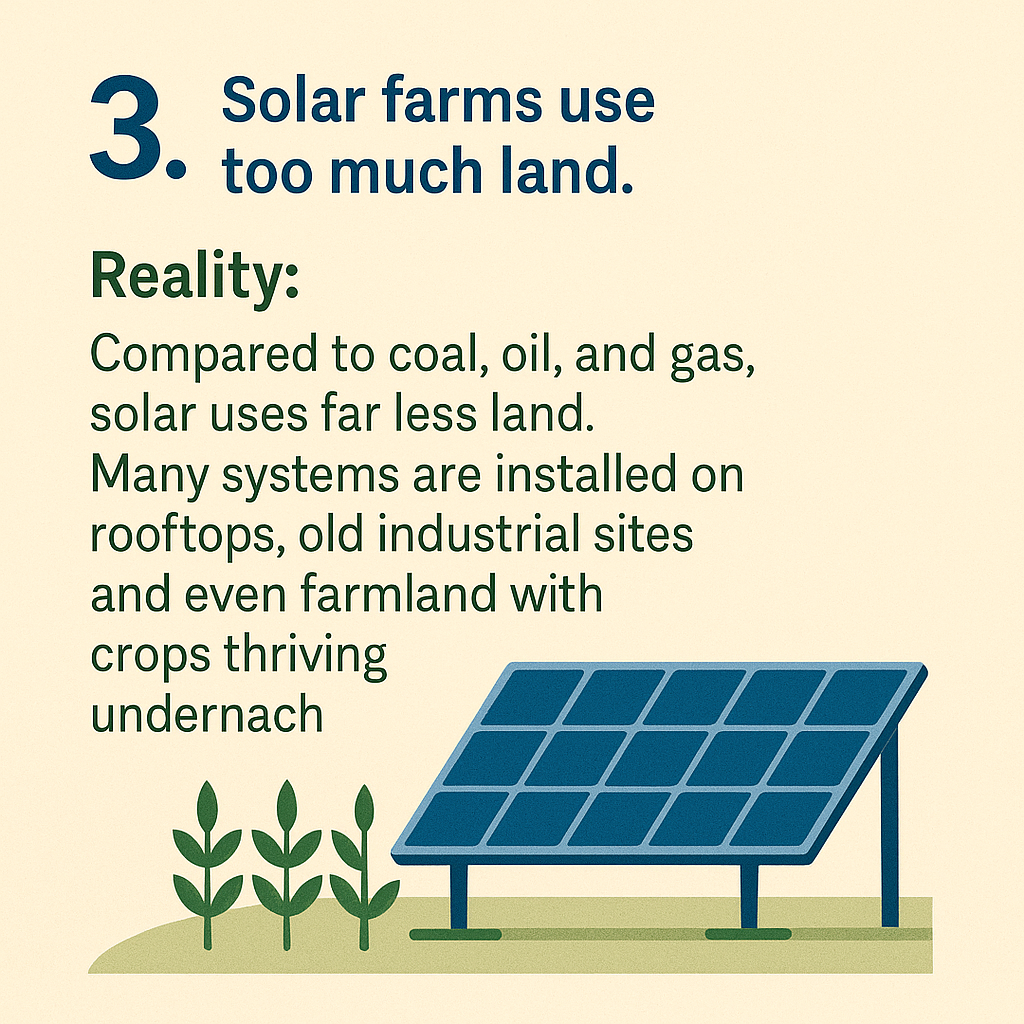
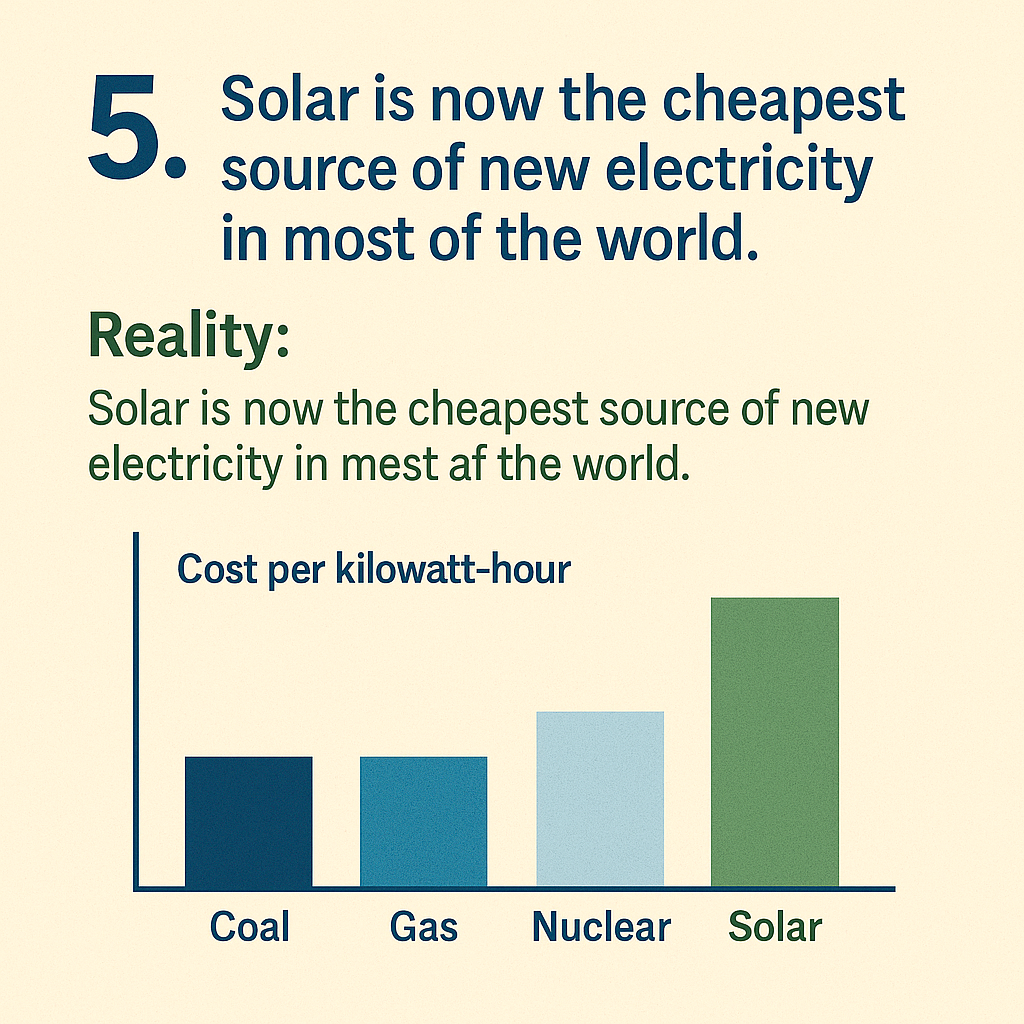
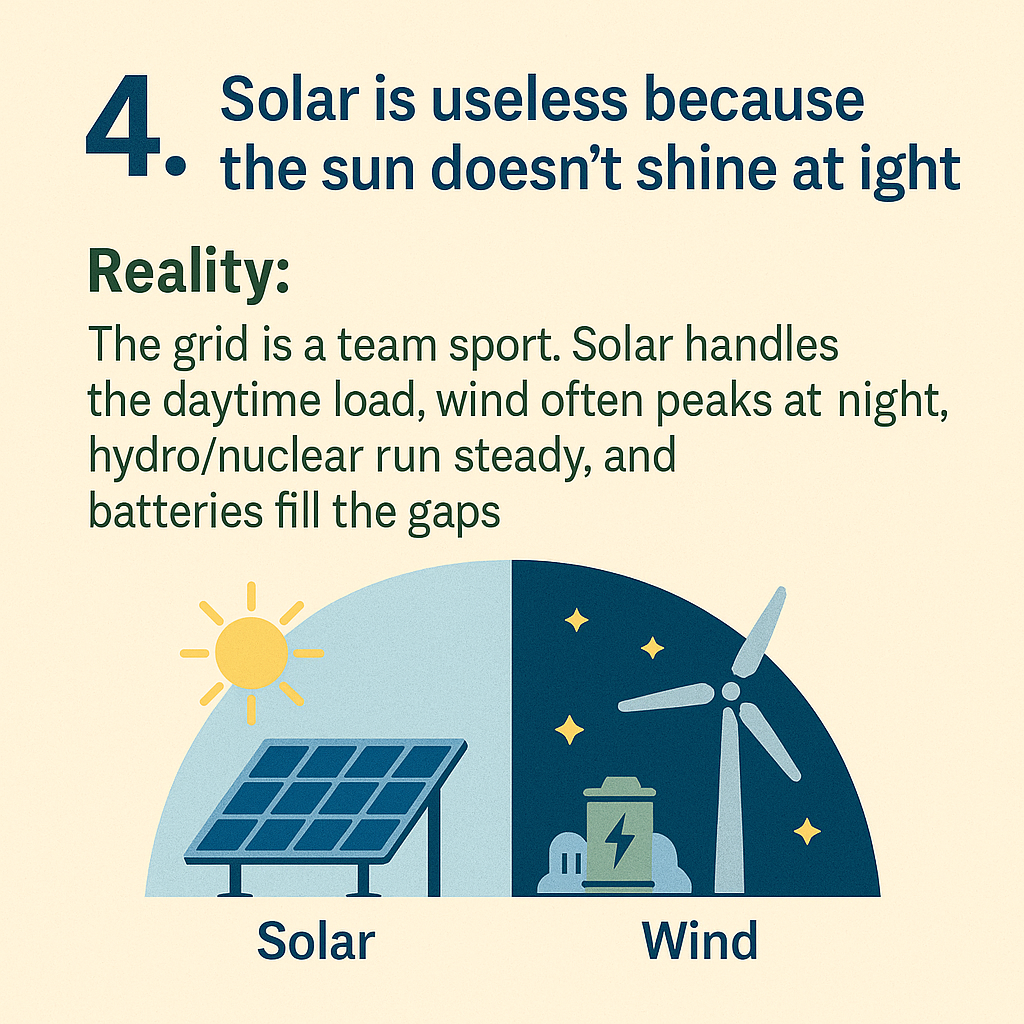
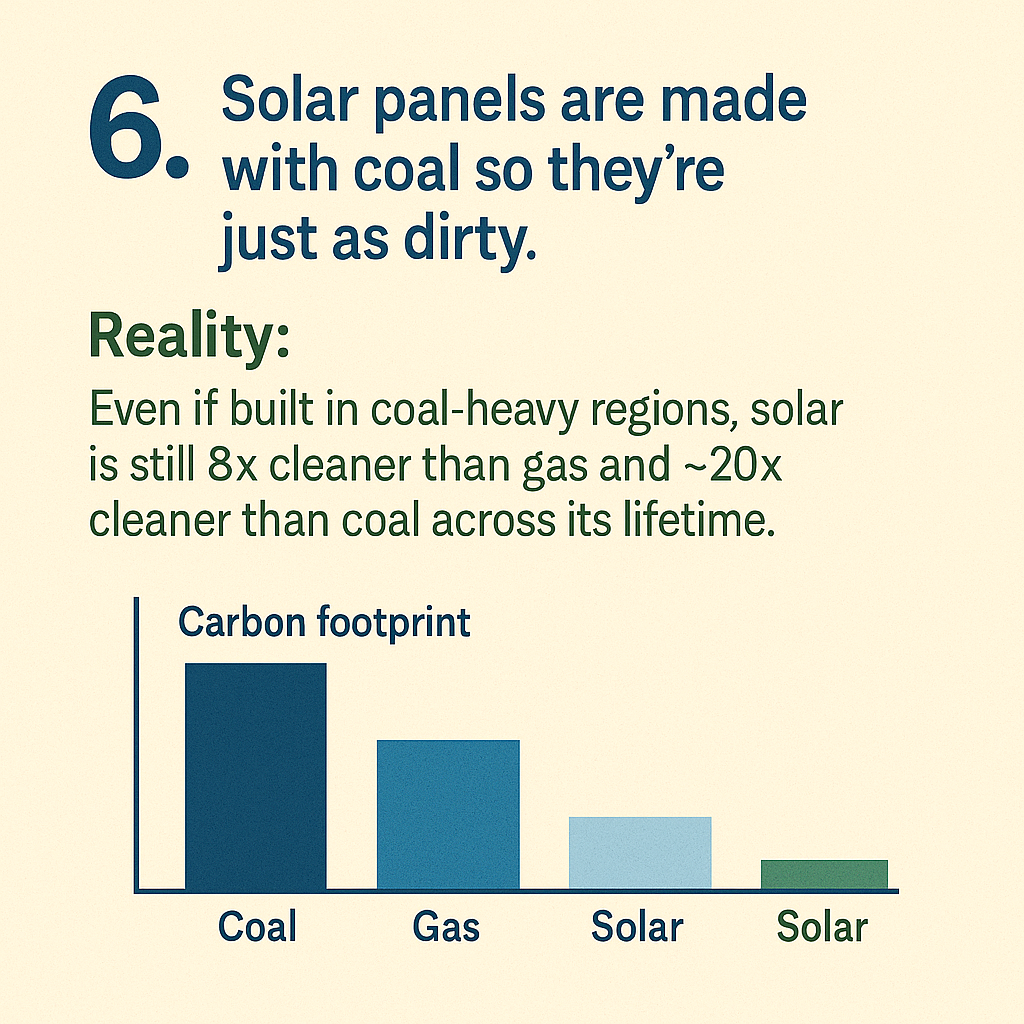
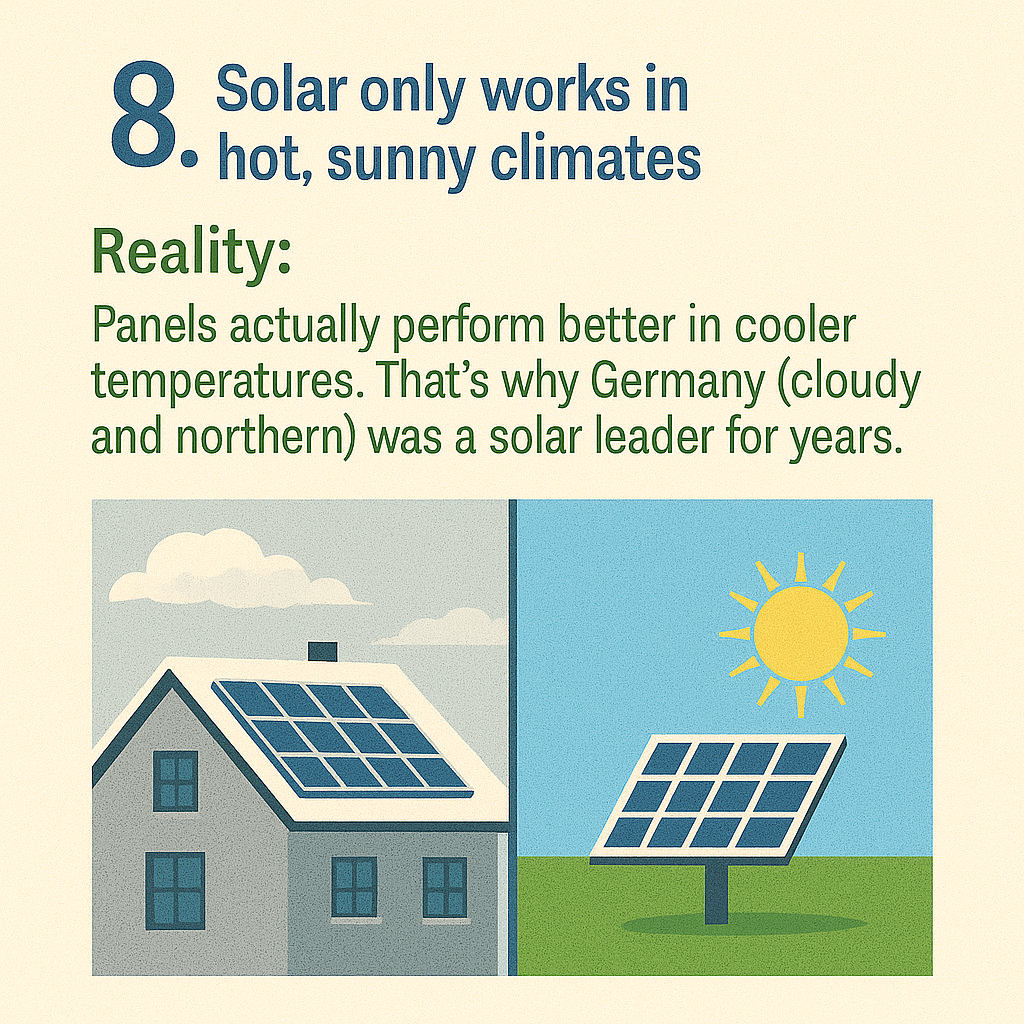
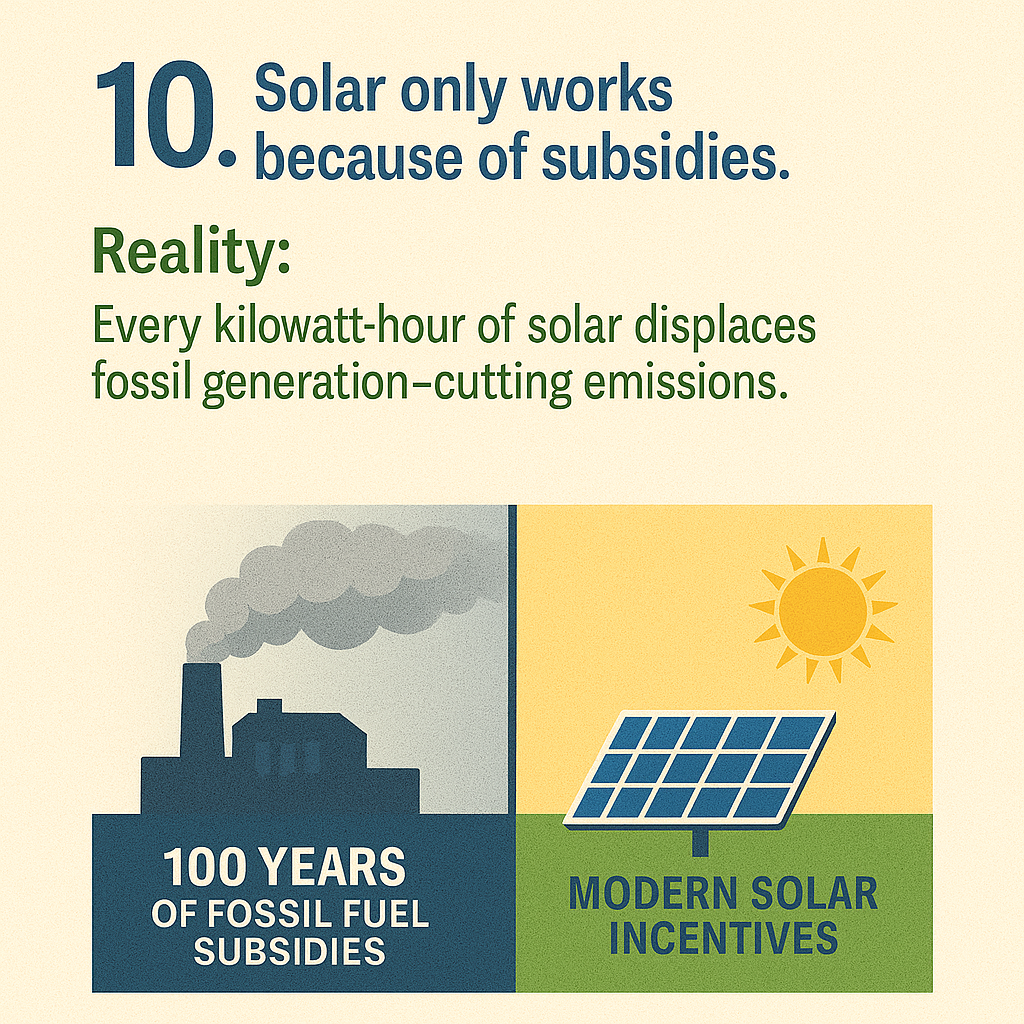
Many potential customers hold misconceptions about solar energy that can deter them from making the switch. These myths often include beliefs that solar panels are too expensive, ineffective in cloudy weather, or require constant maintenance. It's essential to address these misconceptions to provide a clear understanding of the benefits and feasibility of solar energy systems for both residential and commercial applications with BD Electrical Services.
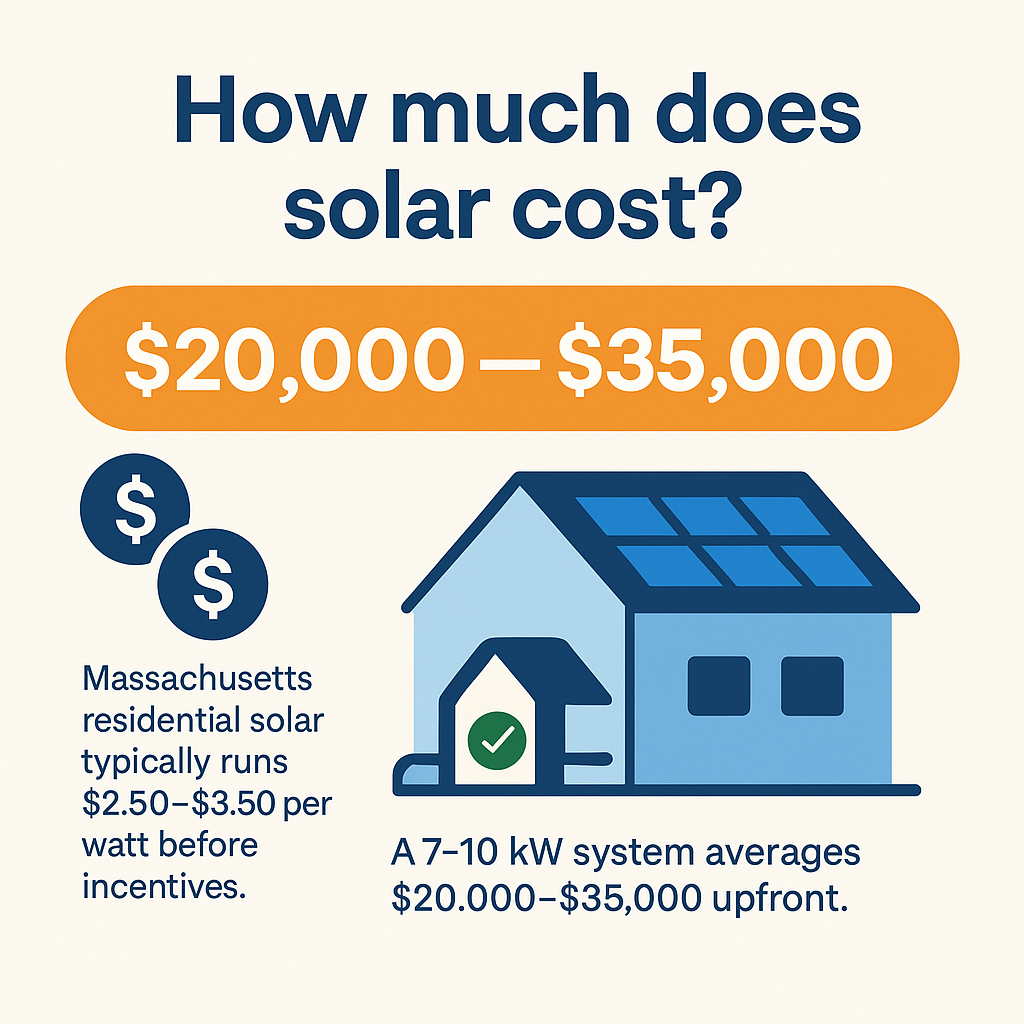
For instance, while the initial investment for solar panels can be significant, numerous financing options and tax incentives can make it more affordable. Additionally, solar panels can generate electricity even on cloudy days, and modern systems require minimal maintenance, debunking the myth of high upkeep costs. Understanding these facts can empower customers to make informed decisions about solar energy with BD Electrical Services.
Solar energy offers numerous advantages for homeowners, including reduced electricity bills, increased property value, and a lower carbon footprint. By harnessing solar power, homeowners can significantly cut their monthly energy expenses and enjoy long-term savings. This financial benefit is a compelling reason to consider solar installations with BD Electrical Services.
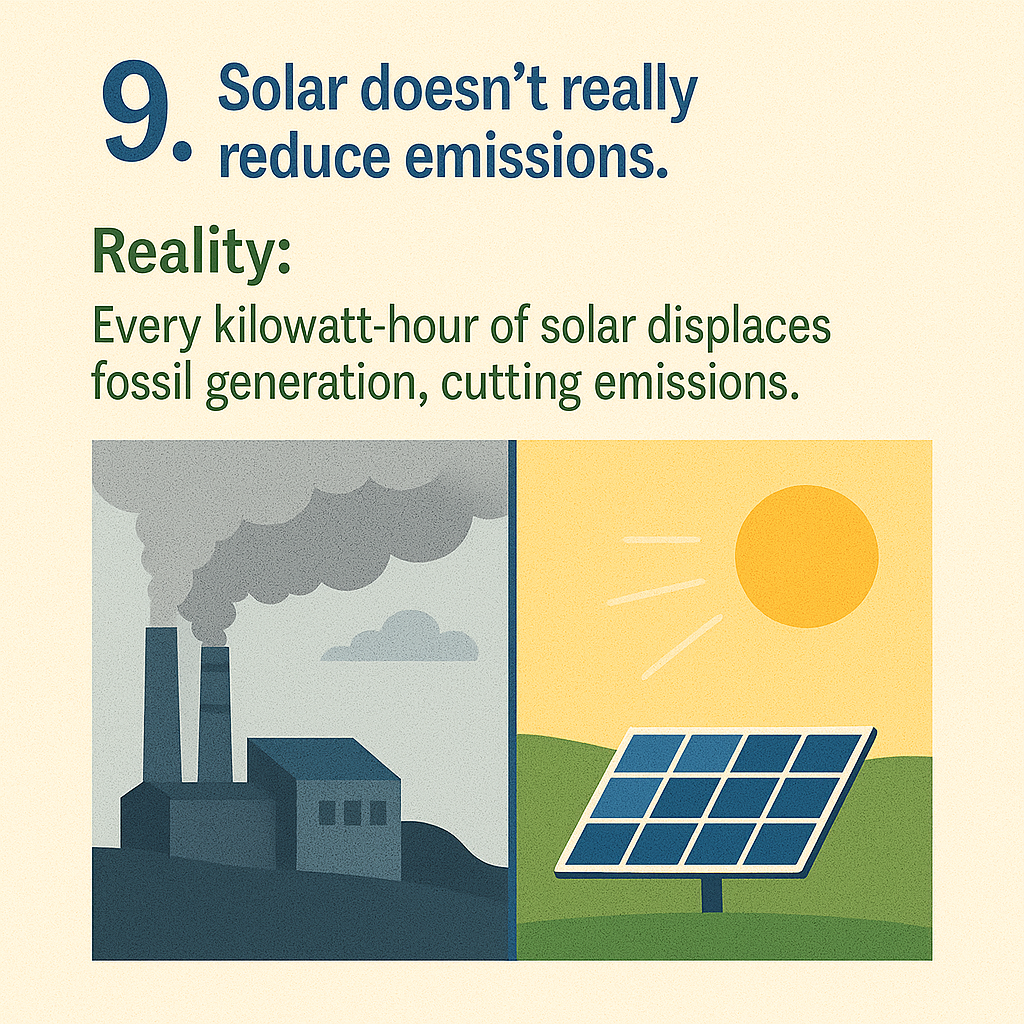
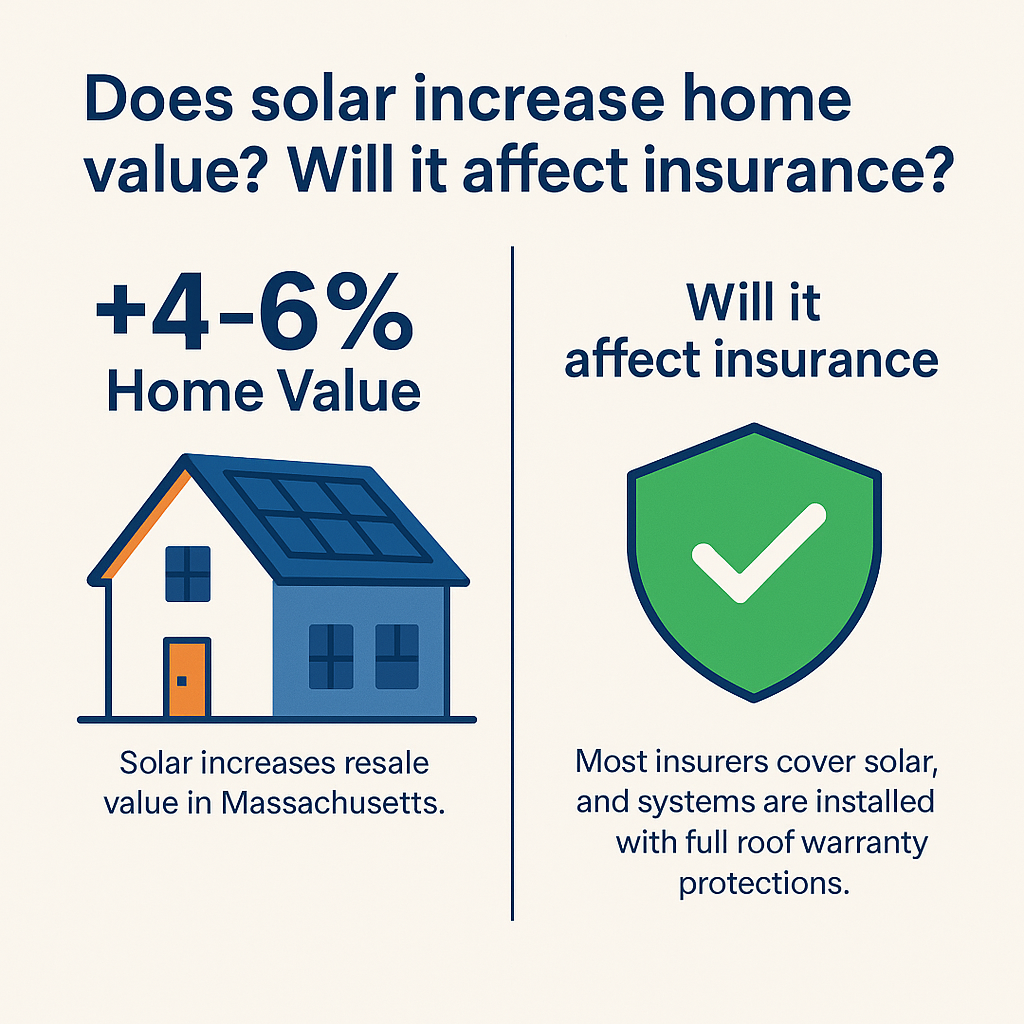
Moreover, homes equipped with solar panels often see an increase in property value, making them more attractive to potential buyers. As the demand for sustainable living grows, having a solar energy system can set a home apart in the real estate market. Additionally, using solar energy contributes to environmental sustainability, reducing reliance on fossil fuels and decreasing greenhouse gas emissions with BD Electrical Services.
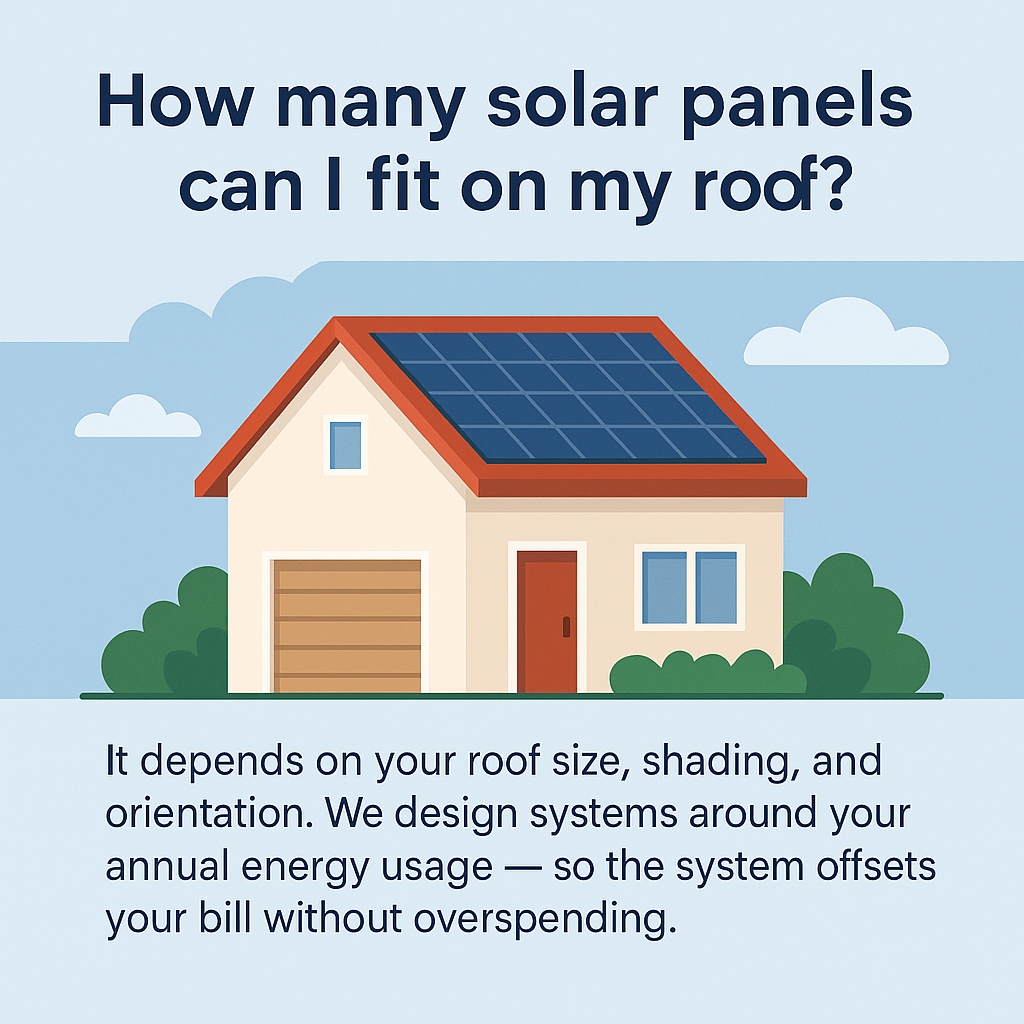
Solar panels operate by converting sunlight into electricity through photovoltaic cells. This technology has advanced significantly over the years, resulting in more efficient and durable panels that can generate more power with less sunlight. Understanding how solar panels work can help customers appreciate their value and functionality with BD Electrical Services.
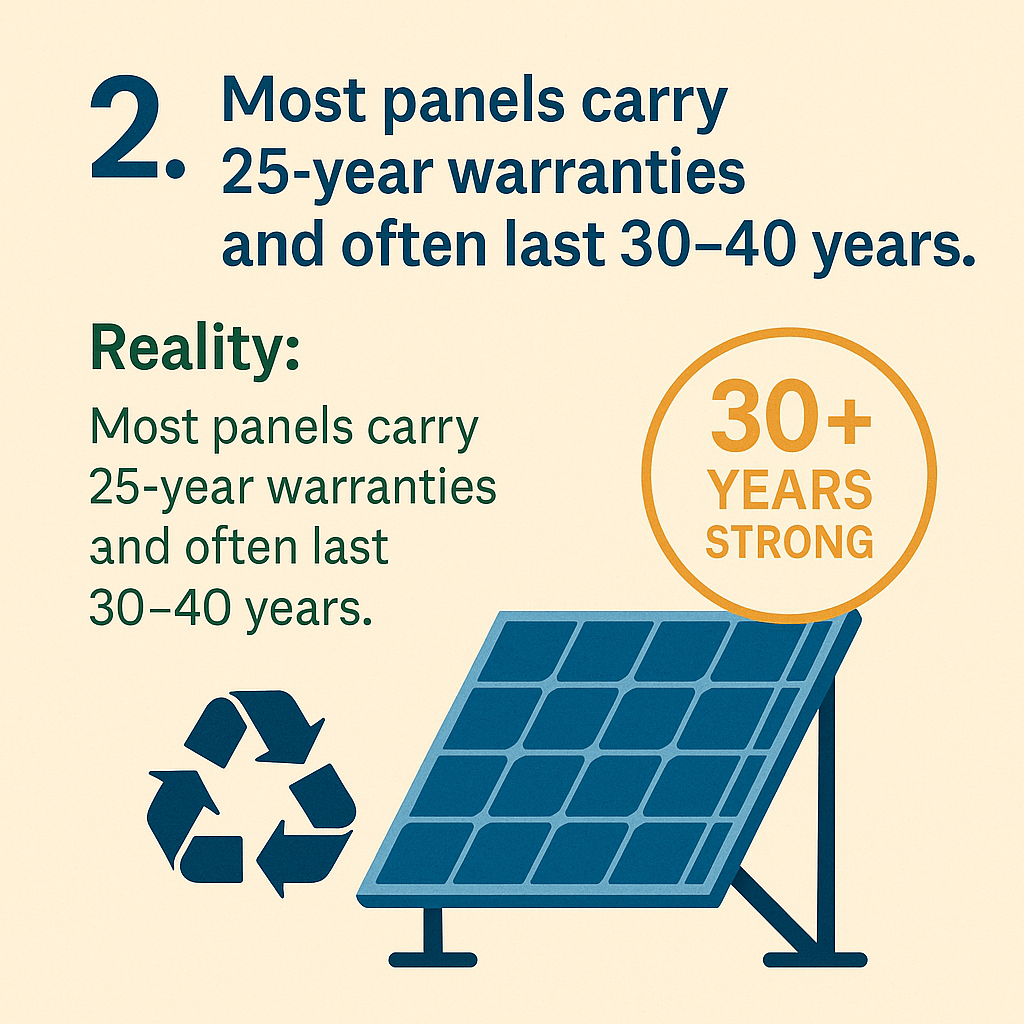
Today’s solar panels are designed to withstand various weather conditions and can last for decades with proper maintenance. Innovations such as bifacial solar panels and integrated battery storage systems have further enhanced their performance and reliability. By educating customers on these technological advancements, BD Electrical Services aims to demystify solar energy and promote its adoption.
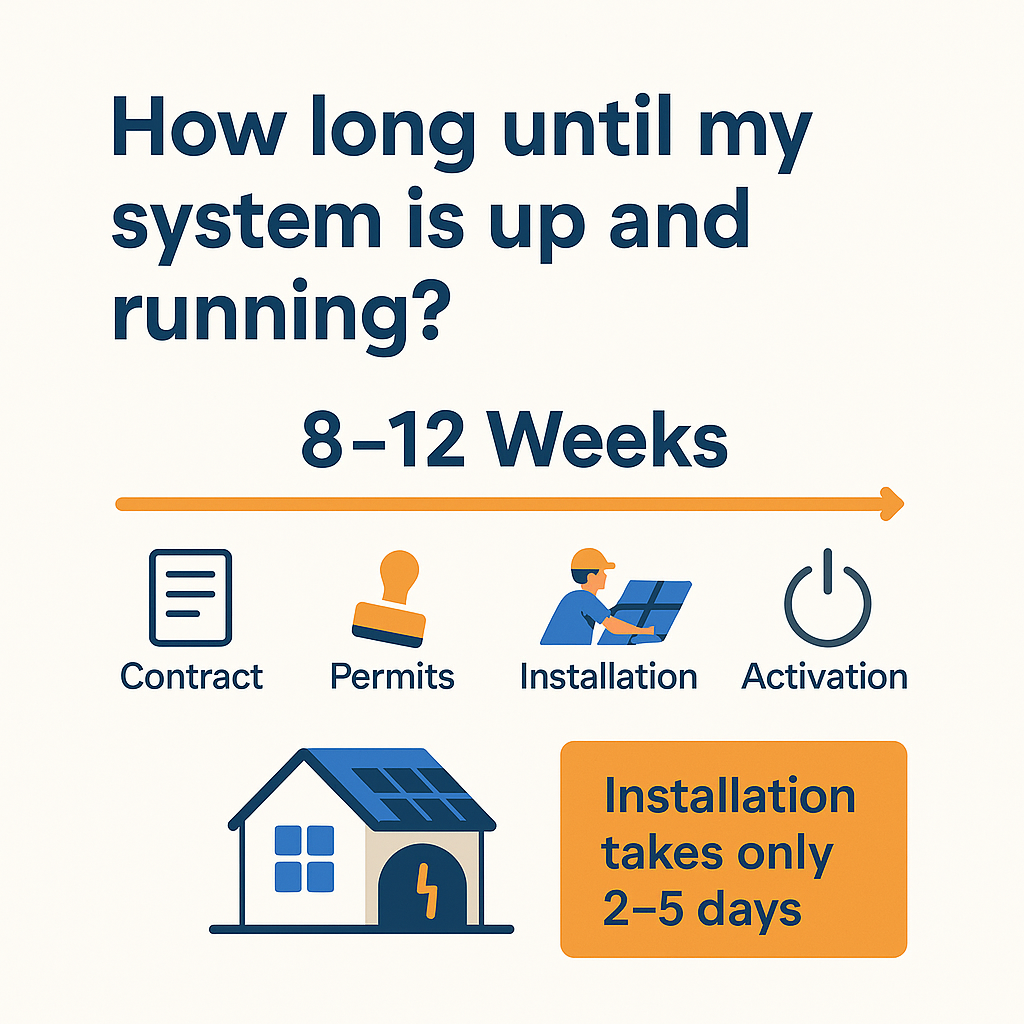
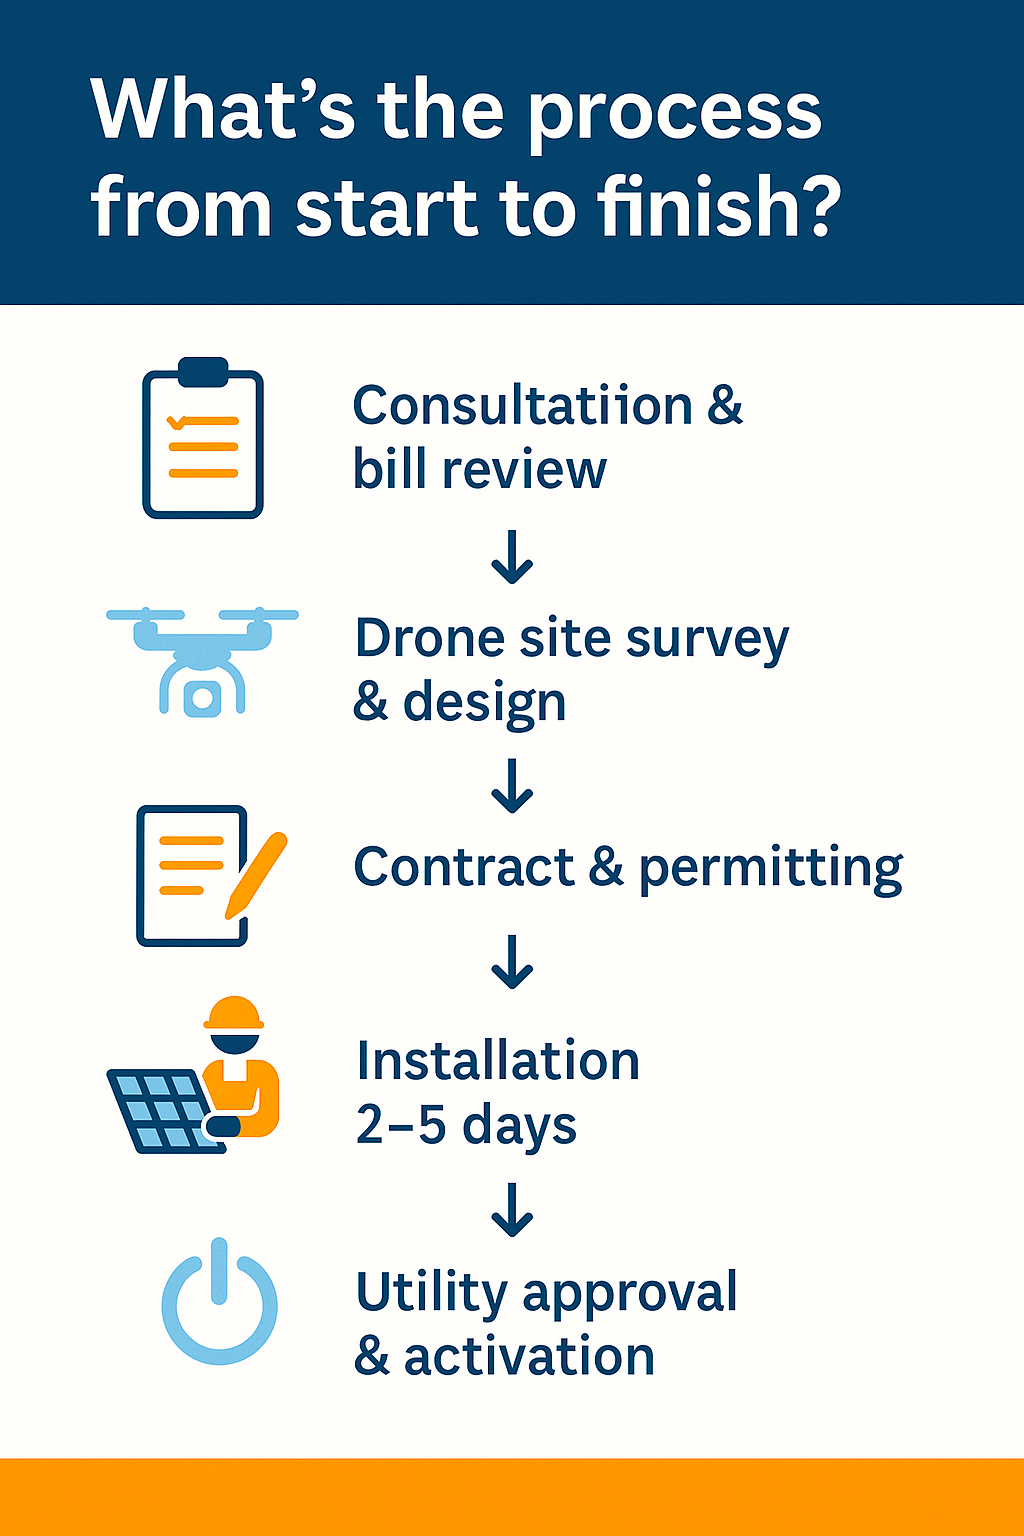
Potential customers often have questions regarding the solar installation process, such as how long it takes, what permits are required, and how to choose the right system. Addressing these questions is crucial in helping customers feel confident in their decision to invest in solar energy with BD Electrical Services.
The installation timeline can vary based on system size and local regulations, but most residential installations can be completed within a few days. Additionally, BD Electrical Services assists customers in navigating the permitting process, ensuring a smooth and hassle-free installation. By providing clear answers to these FAQs, customers can better understand what to expect when transitioning to solar energy.